Plugin development gets new tools and opens-up to the community

Since the introduction of the Gephi Marketplace and tools such as the Plugins Bootcamp we’ve seen more and more plugins being developed. Even developers with little experience with Java give it a try and succeed in creating their first plugin. We want developers to be productive and make it as easy as possible to get started with plugin development and find help along the way. As the release of the 0.9 version is near, it’s time to review our plan on that matter and upcoming improvements. Here’s the summary:

  • The gephi-plugins base repository (i.e. repository plugin developers fork) is now using Maven for building and is simpler. It contains only 4 files versus 890 for the Ant-based system.
  • All Gephi modules are published on Maven central, making it very easy to inspect and extend.
  • Introduction of a custom Maven plugin designed to facilitate plugin development.
  • The submission and review of plugins will be entirely based of GitHub, making it more scalable and transparent.
  • A new online portal for plugins is coming up with an easier edit experience and new features.

From Ant to Maven

Before diving into plugins, let’s first review what has changed on how Gephi is compiled, built and packaged – as this directly affects plugins as well. Since the Gephi 0.8.2 version we have migrated our build system from Ant to Maven. This is in line with what the Netbeans Platform (i.e. which Gephi is based on) community recommends. It already has increased the level of automation we’re capable of as a result. The main benefits are (compared to Ant):

  • Maven is great at dependencies management. It’s now very clear what version of what library Gephi depends on, making it simpler to integrate. Dependencies are also downloaded automatically instead of being checked in the codebase
  • Unlike the Ant-based system, it’s independent from Netbeans. This allows developers not using Netbeans to develop Gephi and produce a build entirely from the command-line.
  • Gephi modules can now be placed on Maven Central (i.e. global repository where Maven finds its dependencies). This allows plugins to automatically find the Gephi dependencies online, reducing the manual steps at each Gephi upgrade.

Build assistant

There are a few critical steps we want to help plugin developers with and as a result started the development of a custom Maven plugin. This new tool will work behind the scenes when developers build their plugin. No installation or configuration is needed as it comes already as dependency of the gephi-plugins module. It already addresses common pain points and hope to automate more and more of the steps in the future. This is what it can do as of today:

  • Plugin validation: The assistant reviews the plugin configuration and metadata at each build. This allows for instance to check if the plugin depends on the correct Gephi version or remind the developer to define an author or license in its configuration.
  • Run Gephi with plugins: A single command allows to run Gephi with the plugins pre-installed. This makes testing faster than ever when developing plugins.
  • New plugin generator: A step-by-step command-line tool that creates the correct folder structure and configuration to get started.

In the future, we want to rely on this build assistant to further automate the process and for instance do easy migration or code generation. For instance, you could ask to generate a Layout plugin code and configuration. Afterwards, all needed would be to fill in the blanks in the code.

A new way to review and submit plugins

As the number of plugins grows, it’s important to have a clear process how plugins are reviewed and updated. We also want this process to be transparent and open to the community. So far, the process was based on the submission of the plugin binaries with a manual review done by the team. This helped us get where we are today, but we want to get it to the next level and propose to entirely move this process to GitHub – using the pull-request mechanism. This has multiple advantages, listed below:

  • Reviewing new/updated plugins can scale because any developer can read the code and contribute to the pull requests.
  • Developers are already asked to fork the gephi-plugins repository so submitting the plugin via GitHub is a natural extension to it.
  • There’s a clear history of each version, comment and what code has changed from one version to another.
  • It makes it easier to test plugins and detect issues before the plugin is approved.

As part of this migration, we’ll no longer add plugins with closed source code but all existing plugins for Gephi 0.8.2 will remain available. For security and stability reasons, it’s essential that each plugin’s code can be inspected before approval. In order for this to work, all existing plugins not already on GitHub or not forking the gephi-plugins repository will need to migrate. For those already set up, the migration will be easier but Ant-based plugins will still need to migrate to Maven.

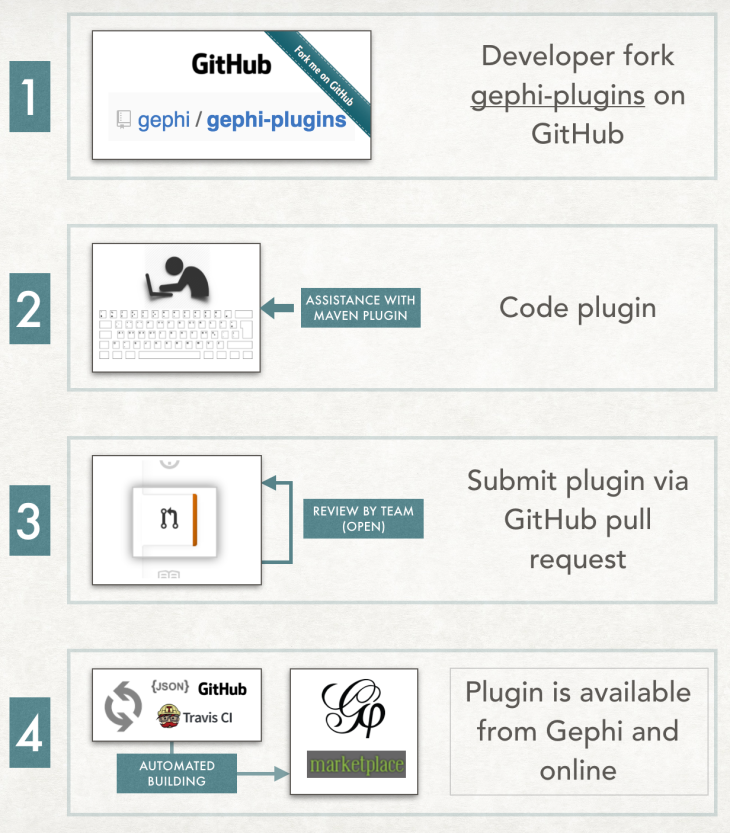
To summarize, this is what the new 4-steps process looks like for developers:

gephi-new-plugin-development-process

In the current submission process we ask for additional information such as description, author or license as well as allow the upload of images. Going forward with GitHub, all of these data will directly be defined in the plugin’s configuration making it easier to update.

A new home for plugins (again)

Plugins are currently available online from the Gephi Marketplace, where users could also reach people providing teachings and support.  We have ideas on how to improve these community services and will be migrating them to a new architecture, starting with the plugins. We will tell you more about these changes in an upcoming post but for now our focus is on developing a new lightweight plugin portal that can directly be connected with the data source on GitHub.

Here is a preview of what it will look like for plugin pages:

new-plugin-frontend-preview


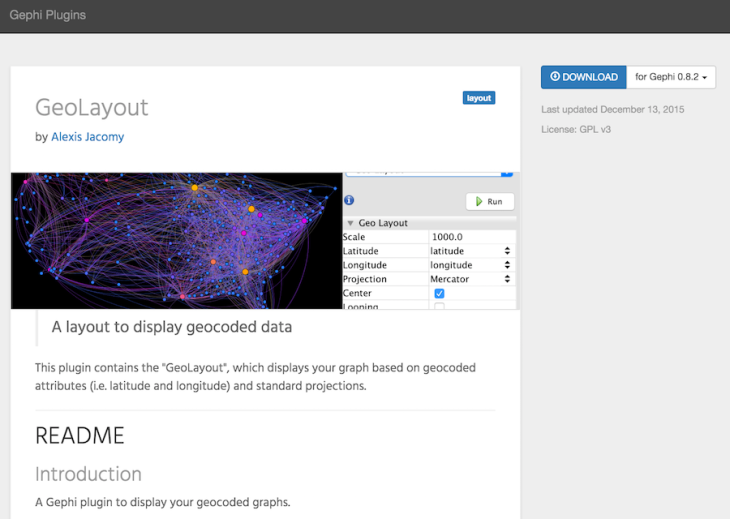
The content of this website will be automatically updated when plugins are published or updated. The way it works is with Travis CI (i.e. continuous integration platform) simply refreshing the JSON file after changes to the plugin repository on GitHub. Developers can even embed images and write the description in Markdown. This will remove entirely the need for plugin developers to login to the marketplace, update NBMs and metadata.

Migrating plugins

This new Maven-based repository along with the new submission process will be introduced with the Gephi 0.9 release. Let’s review what plugin developers need to know to bring their plugin to this new major version.

As with all major Gephi release, plugins compatibility needs to be evaluated as APIs may have changed. In fact, given this new version is based on an entirely redeveloped core it’s very likely code changes will be required. Hopefully, these changes will often be minor and actually simplify things (i.e less, more efficient code). Documentation will be published on these API changes and core developers will be available to answer questions as well.

Plugin developers will also get contacted regarding moving their code to GitHub with a step-by-step guide. We’re considering adding a migrate command to the new Gephi Maven plugin to facilitate the transition from Ant but that’s an unfunded project at the moment (if you’re interested contributing to that, please let us know). Stay tuned for details right after the release on the path to migration.

And again, thanks for all your hard work on bringing your ideas to life though new Gephi plugins!


Python Scripting Console for Gephi

The first release of the Gephi’s Python Console plugin is finally available for download. Through this plugin, you can execute queries and manipulate the graph structure by typing commands on a scripting console, making it a very powerful and concise tool to work with.

This console started as a joint proposal with the GUESS project which aimed at porting the Gython language as a console plugin for Gephi during the Google Summer of Code 2011 program. This project was mentored by Eytan Adar, from the GUESS project, and co-mentored by Mathieu Bastian, from Gephi.

After installation, the plugin can be accessed through the left slide on Gephi’s UI or through the Window > Console.

console

Among the features available through the console scripting language are:

  • Inspired by the Gython language from the GUESS project (i.e. additional operators for manipulating graphs).
  • Based on Jython 2.5.2, which implements the Python 2.5 specification.
  • Graph structure and attributes manipulation.
  • Filtering support.
  • Support for running layouts.
  • Export API support (i.e. generate PDF/GEXF/PNG exports from within the console).
  • Batch scripts support for automating tasks.
  • Loads third-party Python libraries.

For example, if you would like to filter the male persons from your social graph and make the result visible, you could simply type the following command:

visible = g.filter(gender == "male")

If you want set this subgraph nodes’ color to blue, you could just type:

g.filter(gender == "male").nodes.color = blue

Or, even better, if you want to color both the nodes and edges of this same subgraph, just type:

(gender == "male").color = blue

Implementing batch scripts for automating tasks is very easy. Just save the script as a file with the py extension and load it with the execfile function. For instance, a batch script for creating a random graph with 50 nodes would look like this:

scripting_random_graphs

And to run the script, you would call the following command on the console:

>>> execfile("C:\Users\user\Documents\script.py")

Installation

The Scripting Plugin can be installed through the Gephi’s Tools/Plug-ins menu:

  1. Go to the Tools > Plug-ins menu on Gephi’s user interface.
  2. Open the Available Plugins tab.
  3. Click the “Reload Catalog” button, to make sure you have an up-to-date catalog.
  4. Select the “Scripting Plugin” on the list and click the Install button.

After installation, the plugin can be accessed through the left slide on Gephi’s UI (as shown in the image below) or through the Window > Console menu.

Documentation

The console’s documentation at the wiki has instructions for downloading and installing the plugin.

Feedback and Contributing

This plugin has been developed by Luiz Ribeiro since the Google Summer of Code 2011 program and we’re really looking forward to see what you’ll be able to do with this new tool.

The plugin’s source code is hosted on GitHub and is open to your contributions. If you find any bugs or have requests or feature ideas make sure to open a new ticket on the Issues Tracker.

Gephi-Neo4j presentation at FOSDEM

FOSDEM_Brain_Logo_200Martin Škurla, developer of the Neo4j connector in Gephi and former Google Summer of Code student in 2010, gave a complete talk about his plug-in at the last FOSDEM conference in the workshop on Graph Processing. His talk covers the installation and showcase of visualization capabilities of Neo4j graph database in Gephi, as long as the exploration of general useful features of Gephi applying them on imported Neo4j database. Watch the video below, and comment it to ask additional questions!

The Neo4j plugin of Gephi is now officially supported by Neo Technology, Inc. If you have a software project involving Gephi, contact us at consortium@gephi.org to see how we can help you.

Gephi adds Neo4j graph database support, screencast

Neo4j is a powerful, award-wining graph database written in Java. It can store billions of nodes and relationships and allows very fast query/traversal. We release today a new version of the Neo4j Plugin supporting the latest 1.5 version of Neo4j. In Gephi, go to Tools > Plugins to install the plug-in.

The plugin let you visualize a graph stored in a Neo4j database and play with it. Features include full import, traversal, filter, export and lazy loading.


Neo4j Integration into Gephi from gephi on Vimeo.

The plug-in is officially supported by the Neo4j team and is open to contribution! The code is hosted on GitHub.

If you have suggestions please send them our way, we would love to hear your feedback! The forum is the best place for that.

ForceAtlas2, the new version of our home-brew Layout

The new version of the build-in layout ForceAtlas is now released. It is scaled for small to medium-size graphs, and is adapted to qualitative interpretation of graphs. The equations are the same as ForceAtlas 1, but there are more options and innovative optimizations that make it a very fast layout algorithm.

It is good enough to deal with very small graphs (10 nodes)  and fast enough to spatialize 10,000 nodes graphs in few minutes, with the same quality. If you have time, it can deal with even bigger graphs.

Update Gephi (Help > Check for Updates) to get this new layout.

Force Atlas 2:

  • Is a continuous algorithm, that allows you to manipulate the graph while it is rendering (a classic force-vector, like Fruchterman Rheingold, and unlike OpenOrd)
  • Has a linear-linear model (attraction and repulsion proportional to distance between nodes). The shape of the graph is between Früchterman & Rheingold’s layout and Noack’s LinLog.
  • Features a unique adaptive convergence speed that allows most graphs to converge more efficiently
  • Proposes summarized settings, focused on what impact the shape of the graph (scaling, gravity…). Default speed should be the good one.
  • Now features a Barnes Hut optimization (performance drops less with big graphs)


Force Atlas 2 features these settings:

  • Scaling: How much repulsion you want. More makes a more sparse graph.
  • Gravity: Attracts nodes to the center. Prevents islands from drifting away.
  • Dissuade Hubs: Distributes attraction along outbound edges. Hubs attract less and thus are pushed to the borders.
  • LinLog mode: Switch ForceAtlas’ model from lin-lin to lin-log (tribute to Andreas Noack). Makes clusters more tight.
  • Prevent Overlap: Use only when spatialized. Should not be used with “Approximate Repulsion”
  • Tolerance (speed): How much swinging you allow. Above 1 discouraged. Lower gives less speed and more precision.
  • Approximate Repulsion: Barnes Hut optimization: n² complexity to n.ln(n) ; allows larger graphs.
  • Approximation: Theta of the Barnes Hut optimization.
  • Edge Weight Influence: How much influence you give to the edges weight. 0 is “no influence” and 1 is “normal”.


Force Atlas 2 was created by Mathieu Jacomy at the Sciences Po Médialab (Paris), founding member of the Gephi Consortium.

Scientific graphs Generators plugin

Cezary Bartosiak and Rafał Kasprzyk just released the Complex Generators plugin, introducing many awaited scientific generators. These generators are extremely useful for scientists, as they help to simulate various real networks. They can test their models and algorithms on well-studied graph examples. For instance, the Watts-Strogatz generator creates networks as described by Duncan Watts in his Six Degrees book.

The plugin contains the following generators:

  • Balanced Tree
  • Barabasi Albert
  • Barabasi Albert Generalized
  • Barabasi Albert Simplified A
  • Barabasi Albert Simplified B
  • Erdos Renyi Gnm
  • Erdos Renyi Gnp
  • Kleinberg
  • Watts Strogatz Alpha
  • Watts Strogatz Beta

The plug-in can be installed directly from Gephi 0.8, from the Plugins menu.

The source code is available on Launchpad.

The HTTP Graph plugin

The HTTP Graph plugin provides real-time collection and visualization of HTTP traffic. Using the embeddable Membrane Router, details are extracted from the transaction headers and fed to Gephi for graphing and further analysis. This approach makes the relationships between clients, servers, and resources easily visible.


See the video in HD on Vimeo.

Nodes

There are 4 types of nodes: client, uri, host, domain.

Client: By default, the largest sized nodes with the source IP addresses of clients for labels. If you are the only one pointing to the plugin’s proxy, there will probably be only one of these nodes that says 127.0.0.1. Clients are linked to a domain node of ‘local’ to keep them together on the graph. Another function of the client node is to keep the graph anchored. You may find it interesting to use a filter in Gephi to hide the client type nodes to see a more “free-form” graph of the internet. If you do this, you may see large pieces float away because they didn’t link to the rest of the graph anymore!

URI: By default, the smallest sized nodes with no visible labels. These represent resources like HTML pages, images, javascript, or whatever other resources might be requested through the proxy. The size in bytes and the MIME (Content-Type) reported by the host when returning the resource is available so you can see what it is.

Host: For a given domain (.gephi.org, .google.com, etc.) there can be multiple hosts which serve the different resources. In some cases, you may see the same resource being served from multiple servers in a DNS-based load balancing system. Other interesting details about the underlying architecture of the sites you are viewing can be seen.

Domain: These nodes exist primarily to keep the related hosts close together on the graph. You may want to use a filter in Gephi for this type of node and hide them to see a different perspective.

Edges

HTTP and the web are defined by links, which are essentially directed graph edges, and these occur at the resource level. An HTML page resource will link to CSS, image, and other file resources, both on the same domain, and on remote domains. These inter-domain links are the glue that forms the structure of the world wide web.

Have fun!

~by phreakocious

Get the HTTP Graph plugin on the Plugins Center, or in Gephi go to Tools > Plugins > Available plugins.

The Egyptian Revolution on Twitter

This is a preliminary result of the network of retweets with the hashtag #jan25 at February 11 2011, at the time of the announcement of Mubarak’s resignation. If you retweeted someone, or has been retweeted, it is possible that your username is one of these tinny points (or maybe a bigger one?).

To collect the network data, I used the Gephi Graph Streaming plugin, connected it to a Python web server I made myself. This web server works like a bridge, it connects to the Twitter Streaming API using the statuses/filter service and converts the users and retweets to nodes and edges in a network format that can be read by the Gephi Graph Streaming plugin. Nodes are twitter users, and links appear between the nodes A and B when B retweeted a message of A containing the hashtag #jan25.

The static network visualization is just the final result of about one hour of data collection. It is a dynamic network, and it’s possible to get much more information from the collected data. For example, before the announcement, there were few nodes and edges, sparse in time. But when the announcement arrives, a boom of retweets appears on the network. A video with the flow of retweets is available on YouTube. It shows the dynamic network construction during the hour of data collection, compacted in less than four minutes. During the collection, I run Gephi with the Force Atlas layout just adjusting some parameters from default: repulsion strength to 2000, attraction strength to 0.3 and speed to 10.


I was very lucky to get this data. On February 11 afternoon I was testing the Python server that works as bridge and connected to Twitter. I tried some interesting hashtags to see it working, and at the moment #jan25 seemed to be an active hashtag. I let the application run for some time, adjusted some parameters for visualization, and at some point there was a burst in the activity. I didn’t understood what was happening until I checked again my Twitter account and realized that the Egypt’s vice-president had just made the resignation announcement. After it, I proceeded collecting data, and the final result was this network. It was very interesting to see, in real time, the exact moment when Tahrir Square, from a mass protest demonstration, has been transformed in a giant party, and the burst in the Twitter’s activity. It was like covering in real time a virtual event, a big event that was happening in the Twitter virtual world.

After playing with the data, I found that the data I got through the Twitter Streaming API is only approximately 10% of the total. I’m now working to recover all data and hopeful soon I can make available the full graph of retweets.

Dataset available in a GEXF file here. Download it and play with it with Gephi!

André Panisson / www.

—–
This work is part of a research project involving the Computer Science Department of the University of Turin (www.di.unito.it), the Complex Networks and Systems Group of the ISI Foundation (www.isi.it), and the Informatics department of Indiana University (http://cnets.indiana.edu/).
—-

/seadragon-samples/twitter_jan25/seadragon.html

OpenOrd: New layout plugin, the fastest algorithm so far

openorb1-300x300

A new force-directed layout algorithm plugin named OpenOrd has just been released. It is one of the few force-directed layout algorithms that can scale to over 1 million nodes, making it ideal for large graphs.

Features:

  • Very fast, scales to millions nodes
  • Can be run in parallel, run it on multicore processors
  • Aims to highlight clusters

Install it directly from Gephi (Tools > Plugins > Available Plugins) or download it from the Plugin Center. Longer description and source code can be found directly on the plug-in page.

Below is a small demo of how fast this algorithm is layouting a 10K nodes network, and only using one processor.

OpenOrd Layout Demo in Gephi from gephi on Vimeo.

The algorithm original design and implementation can be found at this address. Kudos to the authors!

GSoC 2010 mid-term: Adding support for Neo4j in Gephi

Martin Škurla

During this summer, six students are working on Gephi with the Google Summer of Code. They contribute to Gephi by developing new features that will be integrated in the 0.8 version, released later this year.

My name is Martin Škurla and this summer I was working on GSoC project called “Adding support for Neo4j in Gephi”. In this article we will look at implemented features including these under the hood, pictures of dialogs, common use cases and future plans.


Gephi project

At first I want to make quick introduction into Gephi project. Gephi is Open Source Visualization Platform build on top of the NetBeans platform. It is written in Java so you can run it on various Operating Systems including Windows, Linux, Mac OS. It supports many interesting graph analysis capabilities including:

  • Real-time visualization
  • Layout
  • Metrics
  • Dynamic network analysis
  • Cartography clustering and hierarchical graphs
  • Dynamic filtering

The story so far

The main idea of my project is to add support for Neo4j in Gephi. This means the ability to transform the Neo4j graph into Gephi graph. In fact, both graph models are different so the first task was to make mapping between Neo4j graph items and Gephi graph items and vice versa.

There was also a mismatch between types supported in Neo4j and these supported by Gephi. This mismatch was solved by adding new “List” types into Gephi, so now every type in Neo4j has its appropriate type in Gephi.

There were also some changes under the hood which are not visible to end user, but must be defined and implemented. The most interesting thing is adding “Delegating mechanism”. This mechanism is responsible for getting values from storing engine (Neo4j) as well as manipulation with data. In fact during the importing process, graph representation of Neo4j graph is created in Gephi, but all values are not stored directly, but they are queried using delegating mechanism.

Another minor tasks were to customize the open dialogs used for importing local Neo4j database and debugging the imported database. The open dialog for importing accepts only valid Neo4j database directories. I defined valid Neo4j database directory structure and every valid directory now includes picture of Neo4j in the open dialog. User is able to open only valid Neo4j directories in the process of importing. The open dialog for debugging accepts only Java class files that can be used for debugging process. This simply means they have to implement required interface and have public nonparam constructor. Every valid class file will have Neo4j picture and after selecting a valid debug file, Target and Visualization options will be automatically filled based on data from selected class file.


Open Neo4j directory dialog customization

Open Neo4j debug file dialog customization


Neo4j integration

Menu integration

All possible actions started in menu. As we can see, this is the entry point to import from, export to and debug the Neo4j graph. Both importing and exporting support local as well as remote Neo4j databases.

Importing

Whole graph import dialog

Importing process consist of 2 approaches:

  • whole import
  • traversal import

Whole graph import dialog is designed for importing whole graph. We can customize the rules responsible for returning nodes by defining filtering expressions. For example previous dialog can be used when we want to find all people working on project Gephi with maximum age 30 years. Only people with at least 5 years of experience and those which have driver licence types A, B and C will be included.

Let’s have a deeper look at the dialog:

  • Property key is the name of property we want to filter
  • Property value is the value which will be compared to actual Node property value using chosen operator. Values will be automatically converted into appropriate types and if the value cannot be converted, the node will not be included into graph. All types supported in Neo4j are supported in this dialog. We can also see the support for array types in the last filter expression.
  • Operator will be applied on the final expression and if the expression is evaluated to true, node will be included
  • Match case means the ability to compare String, char, String[] and char[] types with respect of the same case
  • Restrict mode is used to restrict some nodes. Imagine we have people stored in database which have only subset of required property names used in filtering expressions. If the Restrict mode is on, only nodes which have all property names and all filtering expressions evaluated to true will be included. If the Restrict mode is off, every node which has any subset of required property names (even empty subset) will be included if all the filtering expressions applicable to the subset will be evaluated to true.

All the filtering expressions are combined together using AND and the list of current supported operators consist of: ==, !=, <, <=, >, >=.

In fact, usefulness of adding new operators as well as including OR and other useful import options is the main idea behind Questionnaire which is part of this article.

Traversal graph import dialog is designed for importing any subgraph using traversal capabilities of Neo4j v 1.1. Traversal import adds additional options:

  • Start node can be set in two ways, either by its id or by its indexing key and value pair
  • Order can be set to depth or breadth first algorithms
  • Max depth can be set to concrete number or to end of graph
  • Relationships can be restricted too. We can set any combination of Relationship types and directions which should traversal include. The list of Relationship types is dynamically filled from database with existing values.


Traversal graph import dialog

This was the quick summary of Gephi Neo4j importing capabilities implemented in the project. We focused on more features and one of them is the support for exporting. We can export any loaded graph into local or remote Neo4j database. The exporting process can be customized in similar way as importing.

Exporting

Export dialog

Exporting means opposite process to importing. Previous dialog shows exporting options as well as validation. We can customize exporting process by setting:

  • From column is used to set the RelationshipType to appropriate values from any of Gephi edge columns. During importing Neo4j graph, column with name “Neo4j Relationship Type” is automatically created.
  • Default value is used in the case when processed Gephi edge does not have value in selected From column
  • Export Node columns is the set of Gephi columns in node table which will be exported
  • Export Edge columns is the set of Gephi columns in edge table which will be exported

Remote importing/exporting

The only difference between local and remote importing/exporting is the existence of Remote dialog, where we need to set following connection information:

  • Remote database URL
  • Login
  • Password

All of them must be filled in order to successfully import/export remote graph.

Remote import/export dialog

Delegation process

Nodes values exploration (click on the image to enlarge)

As we can see from previous picture, we can very simply explore all the node and edge values. This is exactly the place where delegating mechanism is used. All values are in fact not stored directly in memory in some kind of Gephi data structure, but the storing engine (Neo4j) is requested for actual values every time we need them.

Debugging

Debugging in action

We can see debugging in action in previous picture. The dialog is initialized with data from chosen debug class file, but we can change all of them at the runtime too. Any change in options will automatically update graph visualization. We can change visibility of nodes and edges as well as colors for both nodes and edges. User proceeds to next step of debugging/traversal by clicking on the Next button.

Use cases

That was the quick summary of all implemented features and now we can summarize common use cases every user can be interested in.

Visualizing Neo4j graphs

One of the main ideas of my project was to implement the ability to visualize Neo4j graphs, even big ones. As we saw from the dialog pictures, we have many options how to customize the importing process including filtering. After the import we can use all the rich graph analysis features Gephi provides.

Analyzing only part of the whole graphs

Quite common use case is to analyze only part of the graph, which is possible in Gephi too. We can take advantage of traversing where we can set starting node and other traversal options. After that we can visualize and analyze only part of the graph.

Export graph stored in text files/databases into Neo4j

Another use case could be exporting graphs stored in graph text files or relational databases into Neo4j. In fact, every graph loaded into Gephi can be easily exported to Neo4j database. Importing formats depends on Gephi abilities themselves, currently following formats are supported:

  • Text formats: GEXF, GDF, GML, GraphML, Pajek NET, GraphViz DOT, CSV, UCINET DL, Tulip TPL, XGMML
  • Relational databases: MySQL, PostgreSQL, SQL Server

Future plans

There are more things which we want to implement, including:

  • support for Gephi Toolkit, which is in general set of Gephi core libraries which you can use in your own Java projects for graph visualization and manipulation
  • implementing proof of concept Web application using both Gephi Toolkit & Neo4j to manipulate with Neo4j database & show results (probably using GWT)
  • more features, bug fixing, performance optimizations

Questionnaire

One of the big advantages of Gephi is the fact that it is developed as Open Source project. We want to add additional features according to user requests and their opinions. That’s why we created questionnaire focusing on usefulness of proposed additions. We will be very happy if you fill the questionnaire because it is very valuable source of information and we can focus on features Neo4j users think useful. Please fill in the questionnaire.

Conclusion

I am very happy that I can be part of the Gephi developer community and introduce integration with Neo4j. During this summer I learned a lot and I am proud that I was chosen as GSoC student. The fact is that none of these features can be done without great help of my mentors, so big thank to both of them: Mathieu Bastian & Tobias Ivarsson.

If you are interested in and want to test the code, you can download source codes from my branch using bzr branch lp:~bujacik/gephi/support-for-neo4j

All the pictures were made on data stored in testing Neo4j database which can be created using Java SE project and you can download it using:
bzr branch lp:~bujacik/+junk/testing-new-neo4j-traversal-api


Martin Škurla

Download this article in PDF.